Viewing Reports
In [Report] under [Project] in the side menu, you can view graphs and tables of detection counts per device, aggregated daily, weekly, and monthly. Switch the view with the tabs at the top of the screen.
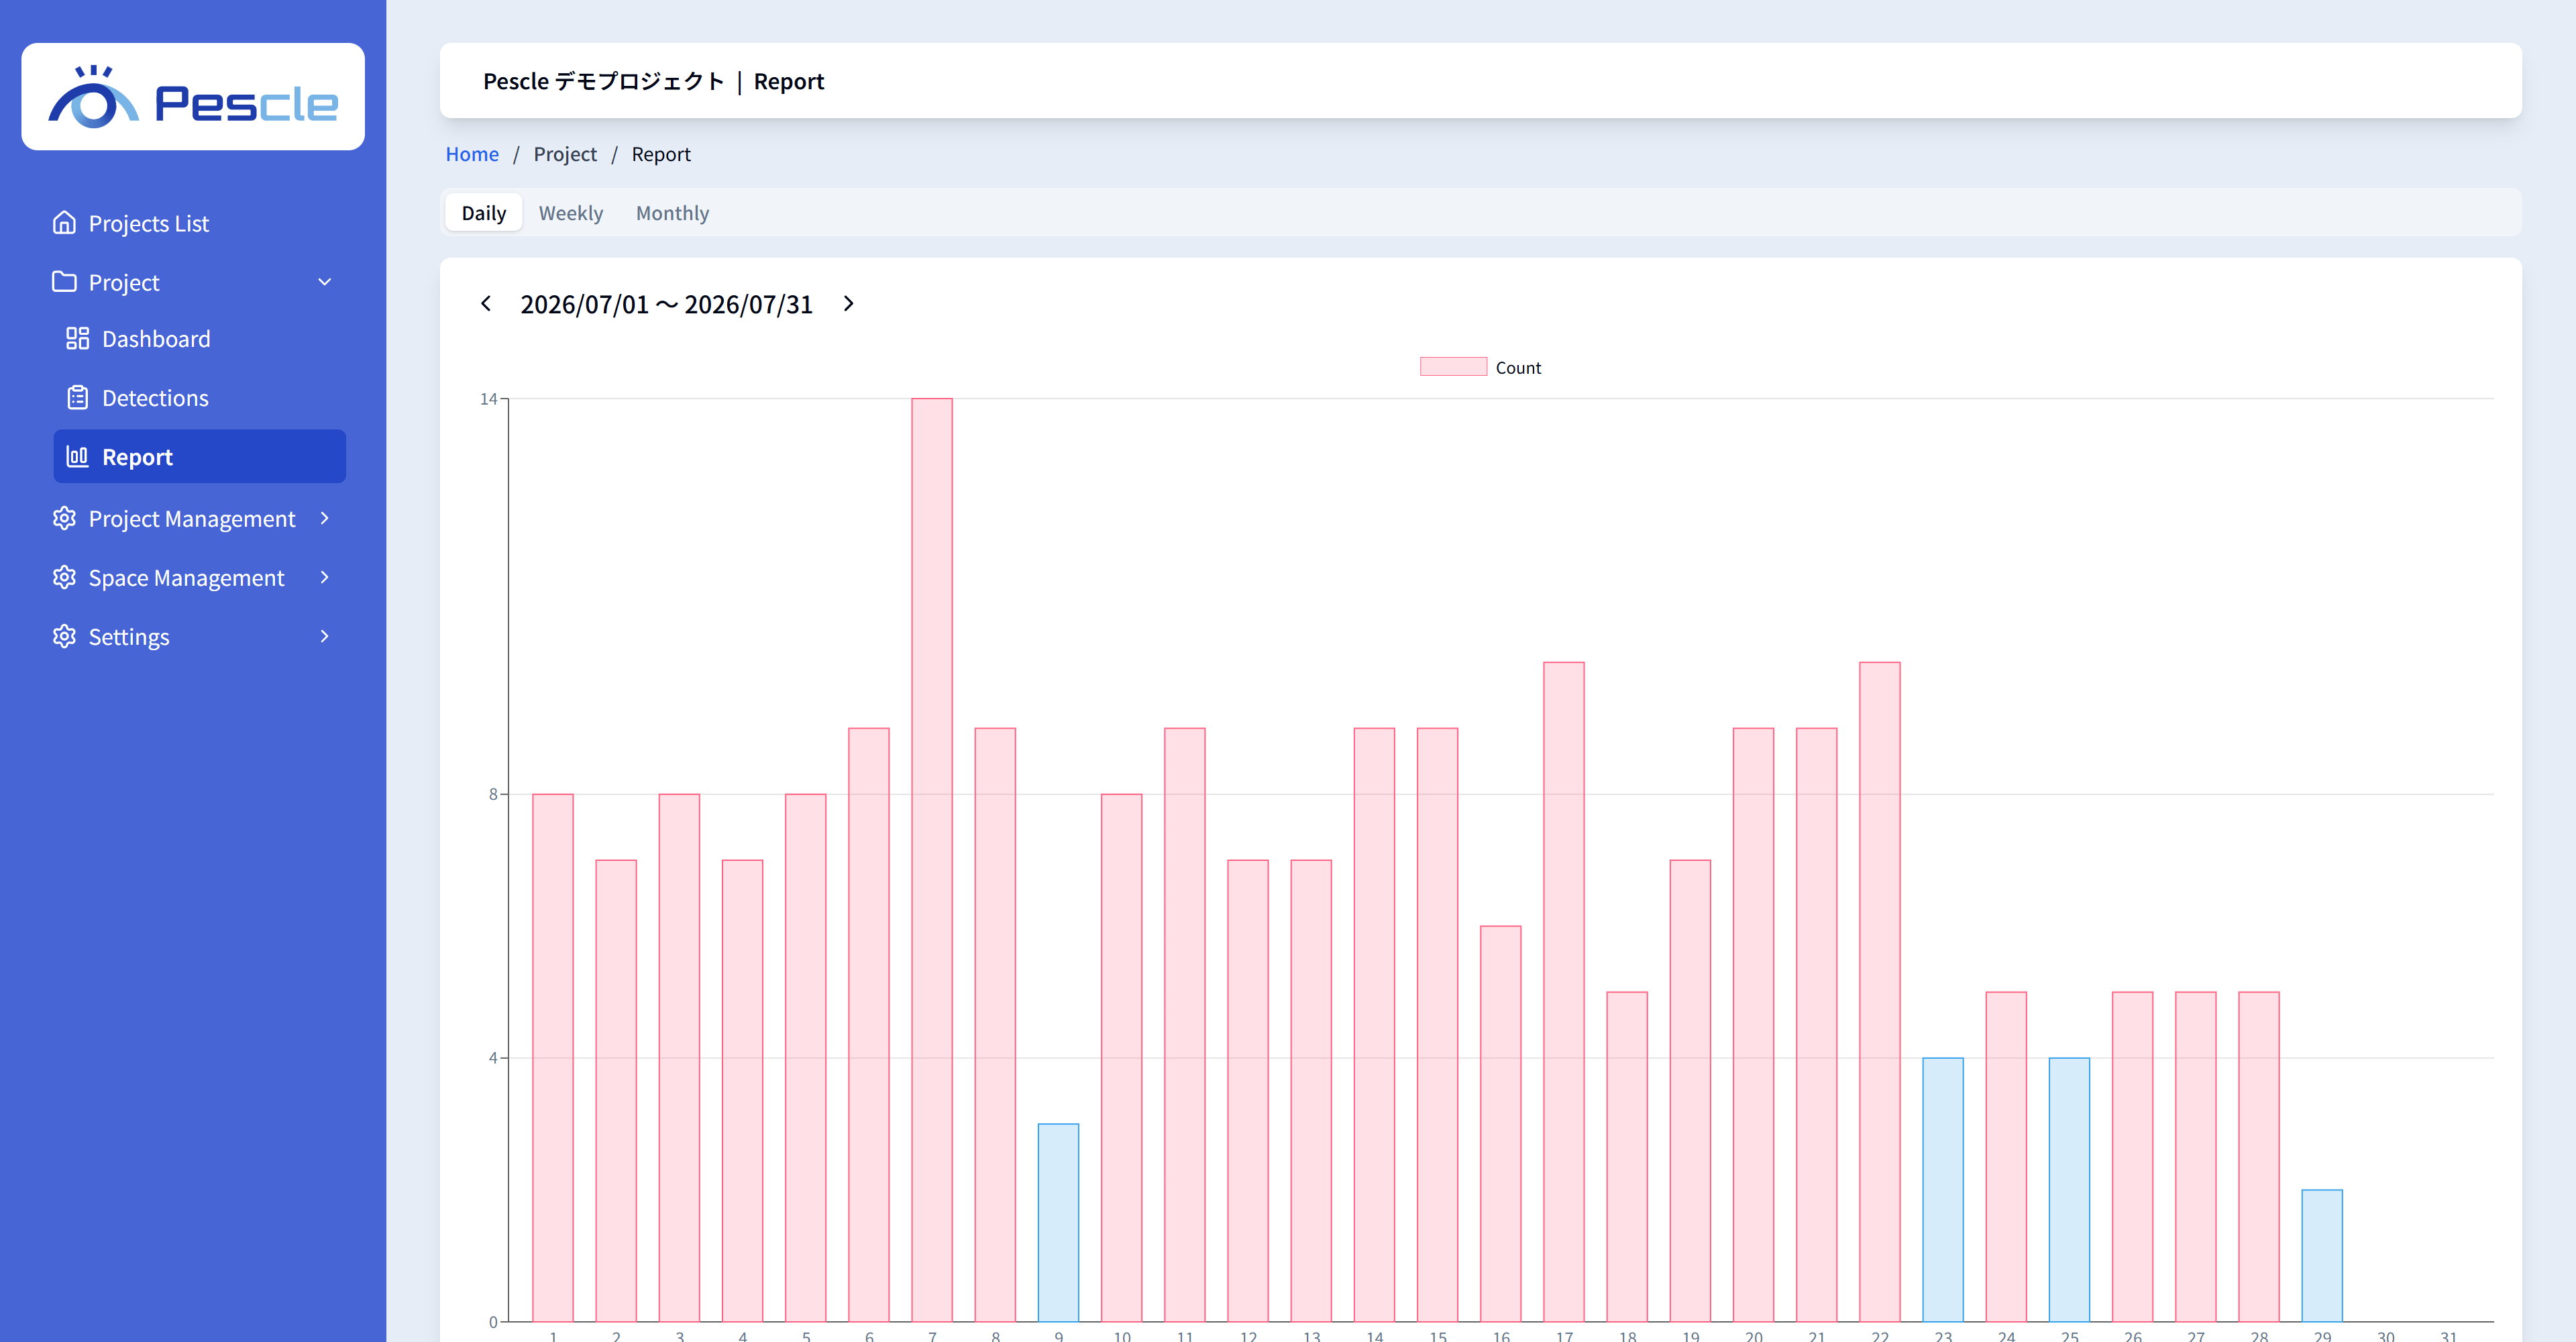
Graph
Shows detection counts as a graph. The graph is normally blue, but turns red when the count is high. Use the arrows next to the date to switch pages.
Detection Count Report
Shows the detection counts for each individual device. Use the arrows next to the date to switch pages.